MicroProfile Health API is a very basic API to report the state of your service, based on one or more Health Probe. It’s very useful in scenarios where some Server or Cluster Controller need to decide if and when your instance should be restarted.
Using MicroProfile Health API in your application is as simple as implementing one (or more) org.eclipse.microprofile.health.HealthCheck and annotating the class with @Health.
The HealthCheck interface has one method you should implement, namely HealthCheckResponse call().
So, you decide, when this method is called, if your instance is healthy.
Your response (HealthCheckResponse) contains:
- a name to identify this probe from other probes.
- a UP or DOWN flag, to indicate the state.
- any other metadata you want to include, in a key-value pair.
A Basic example.
Let’s say we have an application that uses a Database, and if the connection to the database is down (or very slow), we should report this application to be unhealthy:
    @Health
    @ApplicationScoped
    public class MembershipHealthCheck implements HealthCheck {

        @Inject
        private DataSource datasource;

        @Override
        public HealthCheckResponse call() {

            HealthCheckResponseBuilder responseBuilder = HealthCheckResponse.named("membership");
            try {
                Connection connection = datasource.getConnection();
                boolean isValid = connection.isValid(timeout);

                DatabaseMetaData metaData = connection.getMetaData();

                responseBuilder = responseBuilder
                        .withData("databaseProductName", metaData.getDatabaseProductName())
                        .withData("databaseProductVersion", metaData.getDatabaseProductVersion())
                        .withData("driverName", metaData.getDriverName())
                        .withData("driverVersion", metaData.getDriverVersion())
                        .withData("isValid", isValid);

                return responseBuilder.state(isValid).build();


            } catch(SQLException  e) {
                log.log(Level.SEVERE, null, e);
                responseBuilder = responseBuilder
                        .withData("exceptionMessage", e.getMessage());
                return responseBuilder.down().build();
            }
        }
    }
(see the full example here)
In the example above, the health probe name is “membership” and reports UP if a connection to the Database could be established within a certain time. It also includes a few metadata fields w.r.t the database.
/health.
If you browse to /health on your server, you will see an aggregated response from all probes and a total state (UP or DOWN) of the server.
    {
       "outcome":"UP",
       "checks":[
          {
             "name":"membership",
             "state":"UP",
             "data":{
                "databaseProductVersion":"5.5.5-10.1.35-MariaDB",
                "databaseProductName":"MySQL",
                "driverVersion":"mysql-connector-java-8.0.11 (Revision: 6d4eaa273bc181b4cf1c8ad0821a2227f116fedf)",
                "isValid":"true",
                "driverName":"MySQL Connector/J"
             }
          }
       ]
    }
If the database goes down:
    {
       "outcome":"DOWN",
       "checks":[
          {
             "name":"membership",
             "state":"DOWN",
             "data":{
                "exceptionMessage":"No operations allowed after connection closed."
             }
          }
       ]
    }
Creating reusable probes with MicroProfile config.
Certain health probes can be re-used by any of your applications, and you can externalize the settings by using the Microprofile Config API. As an example, if we want a Health Probe that checks the System load, we can externalize at what stage the system load should start reporting down.
    @Health
    @ApplicationScoped
    public class SystemLoadHealthCheck implements HealthCheck {

        @Inject @ConfigProperty(name = "health.systemload.max", defaultValue = "0.7")
        private double max;

        @Override
        public HealthCheckResponse call() {
            OperatingSystemMXBean operatingSystemMXBean = ManagementFactory.getOperatingSystemMXBean();

            String arch = operatingSystemMXBean.getArch();
            String name = operatingSystemMXBean.getName();
            String version = operatingSystemMXBean.getVersion();
            int availableProcessors = operatingSystemMXBean.getAvailableProcessors();

            double systemLoadAverage = operatingSystemMXBean.getSystemLoadAverage();
            double systemLoadAveragePerProcessors = systemLoadAverage / availableProcessors;

            HealthCheckResponseBuilder responseBuilder = HealthCheckResponse.named("system-load")
                    .withData("name", name)
                    .withData("arch", arch)
                    .withData("version", version)
                    .withData("processors", availableProcessors)
                    .withData("loadAverage", String.valueOf(systemLoadAverage))
                    .withData("loadAverage per processor", String.valueOf(systemLoadAveragePerProcessors))
                    .withData("loadAverage max", String.valueOf(max));

            if(systemLoadAverage>0){
                boolean status = systemLoadAveragePerProcessors < max;
                return responseBuilder.state(status).build();
            }else{
                // Load average not available
                return responseBuilder.up().build();
            }

        }
    }
(see the full example here)
Above we can now override the default 0.7 system load to our own value by changing the health.systemload.max config value.
Other examples could include:
- Heap Memory
- Non Heap Memory
- Thread count
Using it in your project
You can use all the above in your project, as it’s available in maven central under the MicroProfile Extensions project:
In your pom.xml:
    <dependency>
        <groupId>org.microprofile-ext.health-ext</groupId>
        <artifactId>healthprobe-system</artifactId>
        <version>XXXXX</version>
        <scope>runtime</scope>
    </dependency>

    <dependency>
        <groupId>org.microprofile-ext.health-ext</groupId>
        <artifactId>healthprobe-jvm</artifactId>
        <version>XXXXX</version>
        <scope>runtime</scope>
    </dependency>
The aggregated result of /health can then look something like this:
       {
       "outcome":"UP",
       "checks":[
          {
             "name":"system-load",
             "state":"UP",
             "data":{
                "name":"Linux",
                "arch":"amd64",
                "processors":"8",
                "loadAverage":"2.03",
                "version":"4.18.1-arch1-1-ARCH",
                "loadAverage max":"0.7",
                "loadAverage per processor":"0.25375"
             }
          },
          {
             "name":"membership",
             "state":"UP",
             "data":{
                "databaseProductVersion":"5.5.5-10.1.35-MariaDB",
                "databaseProductName":"MySQL",
                "driverVersion":"mysql-connector-java-8.0.11 (Revision: 6d4eaa273bc181b4cf1c8ad0821a2227f116fedf)",
                "isValid":"true",
                "driverName":"MySQL Connector/J"
             }
          },
          {
             "name":"non-heap-memory",
             "state":"UP",
             "data":{
                "max %":"0.9",
                "max":"-1",
                "used":"132792064"
             }
          },
          {
             "name":"threads",
             "state":"UP",
             "data":{
                "max thread count":"-1",
                "daemon thread count":"86",
                "monitor deadlocked thread count":"0",
                "thread count":"134",
                "deadlocked thread count":"0",
                "started thread count":"138",
                "peak thread count":"136"
             }
          },
          {
             "name":"heap-memory",
             "state":"UP",
             "data":{
                "max %":"0.9",
                "max":"14995161088",
                "used":"207556800"
             }
          }
       ]
    }
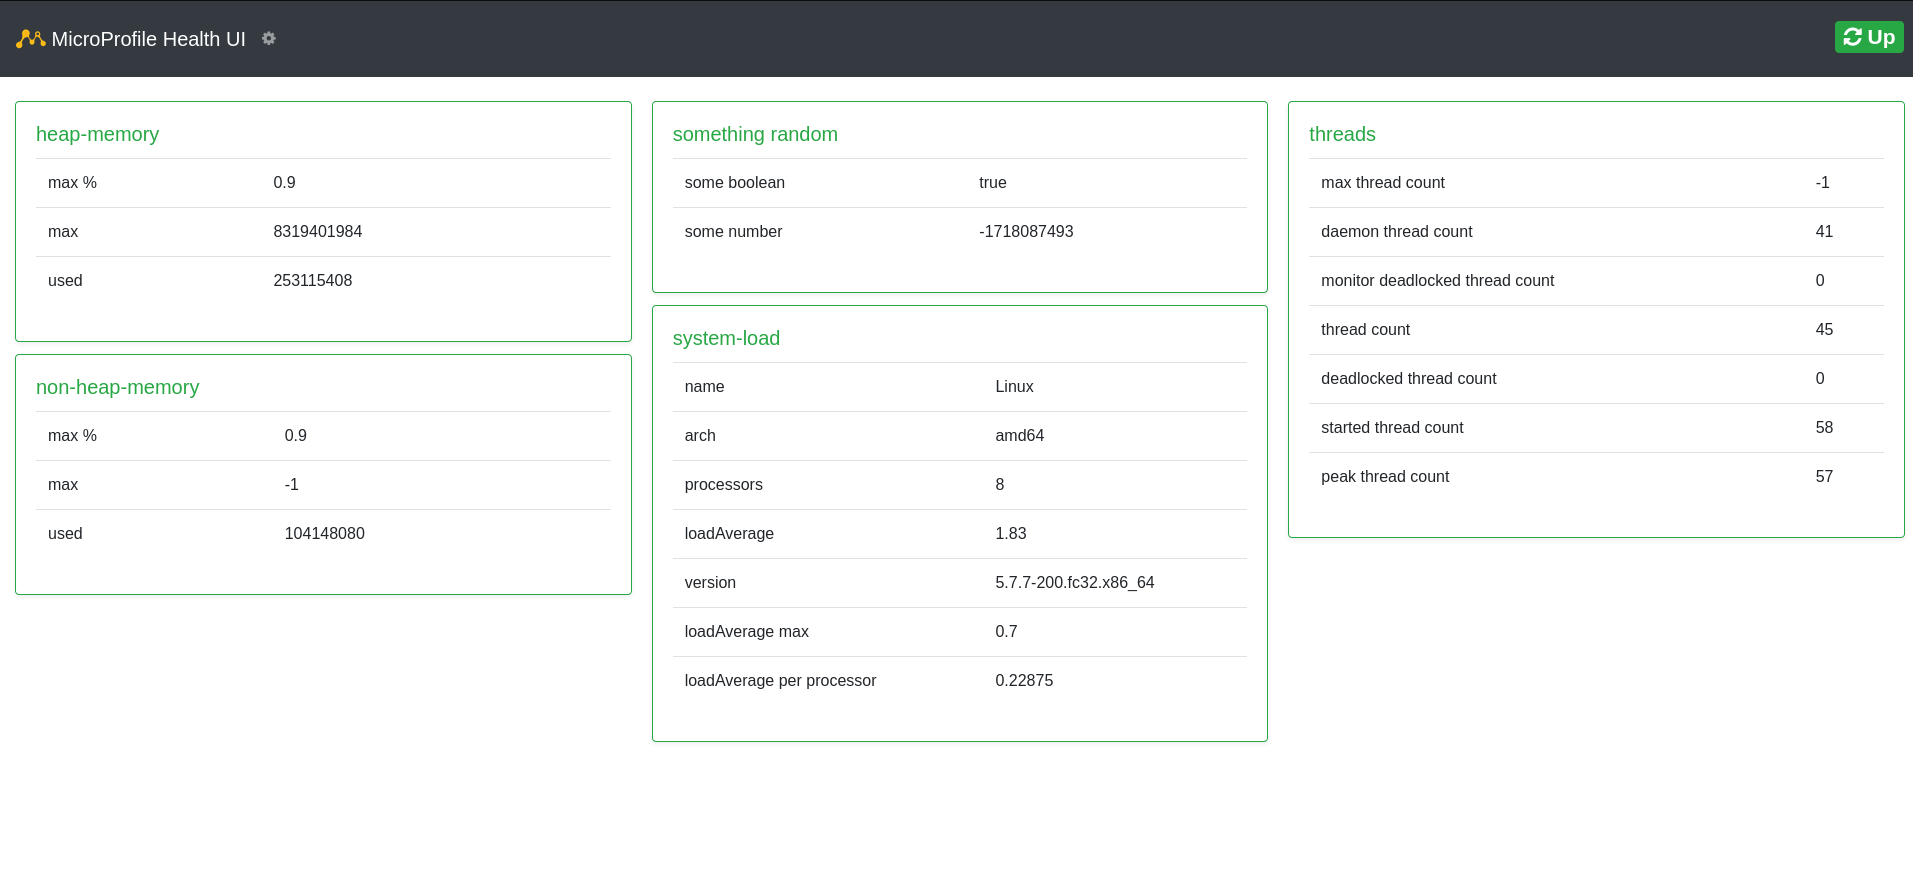
Adding a nice UI
Even though MicroProfile Health API is build for System to System use, it’s still nice to look at the output of /health.
This library gives you a small web gui on top of /health
In pom.xml
    <dependency>
        <groupId>org.microprofile-ext.health-ext</groupId>
        <artifactId>health-ui</artifactId>
        <version>XXXXX</version>
        <scope>runtime</scope>
    </dependency>
Then go to /<context_root>/health-ui, eg: http://localhost:7080/profiling/health-ui/
Example screenshot